The typical Swansea home sold for £203,000 in the year to April, up 1.5% on the year before, according to a new analysis that cuts every Land Registry sale in the county into 250-metre squares. That headline hides most of what happened.
In Mumbles the median sold price fell 5.7% to £363,000. In Castle ward, the city centre, it rose 7.8% to £127,500. Between them lie 33 wards moving in different directions, and a map on which you can find your own street.
The coast fell, the east rose
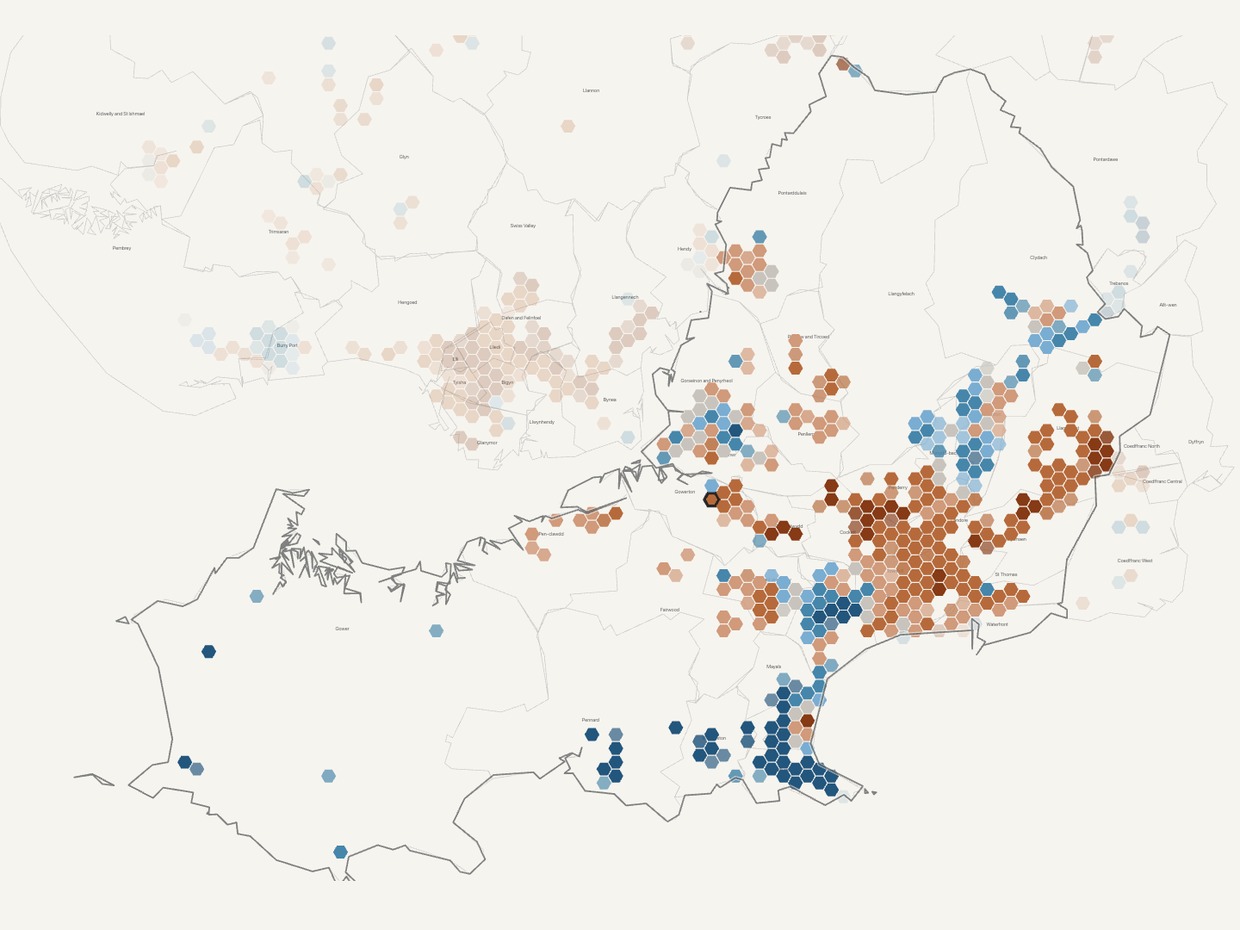
The ten wards where prices fell most are almost all on the coast: Mumbles, Bishopston (down 4.6% to £385,000), West Cross (down 4.5% to £344,000), Mayals, Pennard, Gower and Sketty, the county’s busiest market with 397 sales in two years, down 0.9% to £287,500.
The risers are the other side of the city: Castle, Cwmbwrla (up 6.2% to £140,000), St Thomas (up 6.1% to £140,000), Penderry, Bôn-y-maen, Cockett, Landore and Llansamlet, where the median reached £183,000. Morriston, the county’s second-biggest market, was flat at £180,000.
Lorcan O’Connor, who runs Housometer, the site behind the analysis, said the pattern was the striking finding: “the higher-end southern part of the city is seeing prices decline whilst the urban centre is still rising”.
The £355,000 gap
The cheapest ward to buy in was Castle, at a median of £127,500. The dearest was Gower, at £482,500, nearly four times as much. Penllergaer, at £314,000, was the most expensive ward away from the coast.
Across the county the middle 80% of sales ran from £88,000 to £725,000. The single most common price paid was between £150,000 and £175,000, with 692 sales in that band, and 13 homes sold for more than £1m, all of them detached.
What each kind of home fetched
Detached homes did best, with the median up 4.6% to £340,000. Semis rose 3.2% to £210,000 and terraces 3.3% to £155,000. Flats went nowhere, at £130,000.
Fewer homes changed hands: 2,637 sales in the year to April against 3,036 the year before, though Housometer says the most recent months are still being registered and will fill in.
Buyers came back in August, surveyors say
The sales figures stop in April, and the estate agents’ trade body says the summer looked different. In the Royal Institution of Chartered Surveyors’ August survey, a net balance of 44% of Welsh surveyors reported more new buyers, the strongest reading in two years, and 50% reported more agreed sales. On prices, a net 10% saw rises, after a flat July.
Anthony Filice of Kelvin Francis in Cardiff said: “Against all expectations, the market in August was very busy.” The RICS head of market research, Tarrant Parsons, was more careful, calling any recovery “fragile” with the Bank of England sounding hawkish and the October Budget prompting speculation about property taxes.
Six years in one line
The quarterly figures show the road here. A typical Swansea home sold for £162,000 in spring 2020, £190,100 in spring 2022 and £200,000 in spring 2024, and has sat between £207,000 and £210,000 through the past year.
Price per square metre, which strips out the size of what sold, tells the same story: £2,345 across the county, from about £1,550 in Castle and Landore to £3,947 in Gower and £3,712 in Mumbles.
How to read the map
The map below colours every 250-metre square with three or more sales by its median price, and the third view shows which are rising and which are falling. Housometer’s figures come from HM Land Registry’s price paid records and the EPC register, and are fixed at sales recorded to April 2026, so they will not change as new sales register.
Each square is a median of a handful of sales, so any one hexagon can be skewed by a single house; the pattern across an area is the finding, not the colour of your own square. The UK House Price Index, the official measure, puts Swansea at £205,566 and up 1.1% in April, using the same sales and a different method.

Discover more from Swansea Bay News
Subscribe to get the latest posts sent to your email.